Customized Grafana Dashboard Project
- Industry:
- Software Development
Introduction
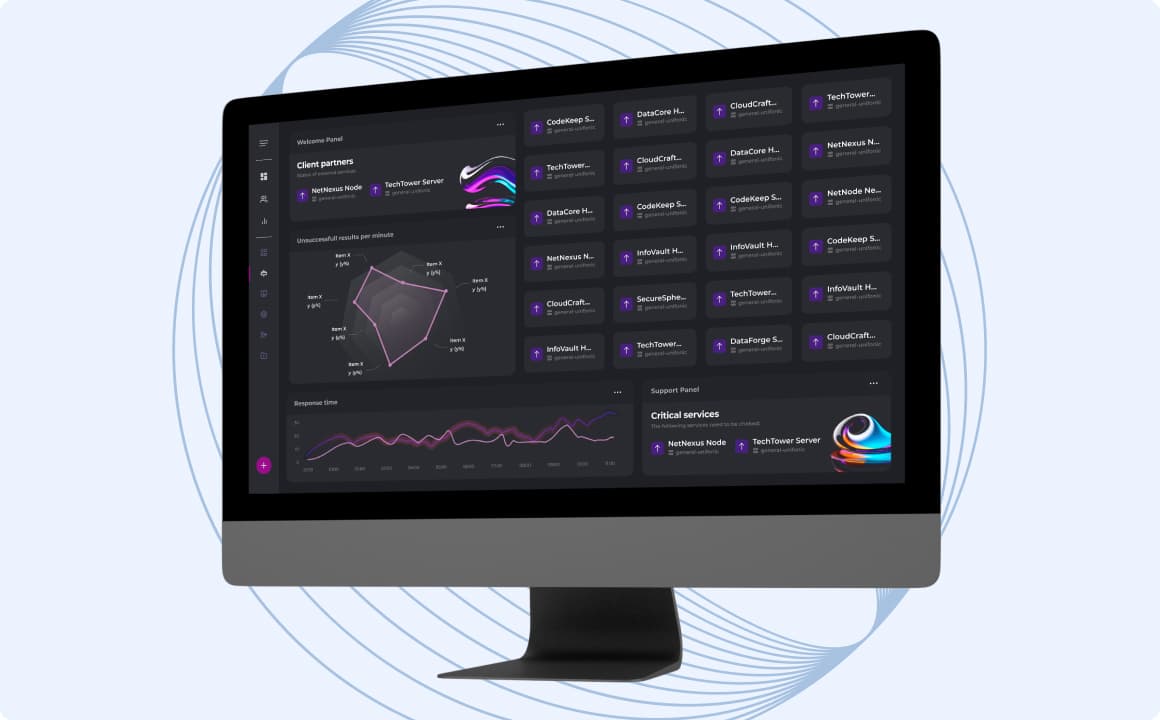
P2H embarked on a transformative project with a prominent Saudi Arabian holding company operating in the government and semi-government sectors. The project’s focal point was the enhancement and customization of Grafana dashboards. These dashboards are crucial for the client’s data visualization needs, requiring a blend of aesthetic appeal and functionality.
BackgroundThe client focuses on enhancing its capabilities in data visualization, specifically targeting the monitoring of integration services health check status. They aim to transform traditional Grafana dashboards into more dynamic, visually engaging, and user-friendly interfaces. This upgrade is driven by the need to render complex datasets accessible and understandable to a broader audience, including stakeholders and decision-makers within the government and semi-government sectors.
ObjectiveDevelop advanced, customized Grafana dashboards with futuristic designs, ensuring they are not only visually appealing but also offer comprehensive data analysis capabilities. The project aimed to enhance the client’s data visualization tools to support better decision-making processes, improve transparency, and foster a more data-driven approach in governmental operations.
Challenges
Customization
Matching Figma designs within Grafana’s customization capabilities.
Data Integration
Integrating various data sources for real-time visualization.
Client Feedback
Iterative refinements based on detailed client input
Solutions

Custom Dashboard Development
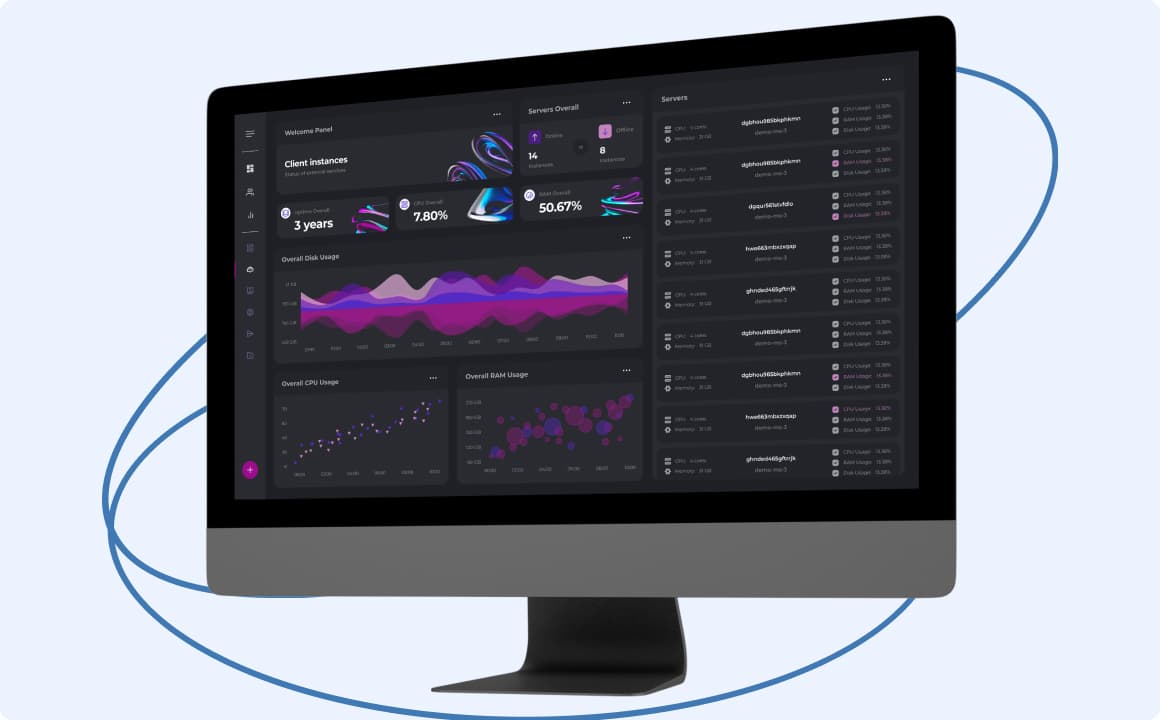
Utilizing Grafana’s flexibility, the team designed dynamic dashboards with custom CSS and JavaScript to meet the client’s unique aesthetic and functional requirements.
Advanced-Data Visualization
Employed sophisticated techniques for displaying complex datasets intuitively, leveraging Grafana’s analytics and interactive features.
Data Sources Integration
Ensured seamless real-time data updates from various sources for accurate and reliable dashboard displays.
Responsive Design
Focused on creating dashboards that are accessible and performant on multiple devices, enhancing overall user experience.
User Customization
Added features for end-user customization, allowing personalized interaction with the dashboard.
Process and Execution
- Design and Prototyping Initiated with a focus on creating user-friendly and futuristic interfaces using Figma. This phase was characterized not just by aesthetic design but also by incorporating advanced techniques like linear interpolation for smooth data visualization, ensuring the designs were versatile and adaptable for future developments.
- Implementation This stage involved the precise translation of Figma designs into Grafana environments. We employed extensive customizations using CSS and JavaScript, integrating sophisticated data processing and transformation methods. This approach ensured the dashboards were not only visually compelling but also robust, efficient, and flexible in handling complex data sets.
- Iterative Development We maintained a constant feedback loop with the client, which allowed for iterative refinements of the dashboards. This process ensured alignment with the client’s expectations and specifications, emphasizing functionality and user experience.
- Future-Proofing A pivotal aspect of our strategy was creating a bulletproof solution. Our design and implementation were meticulously planned to be forward-compatible, focusing on adaptability to upcoming Grafana updates. This foresight in development ensures that the dashboards are equipped to seamlessly integrate with major future changes in Grafana versions, safeguarding the client’s long-term investment.
P2H Team Composition
Tech Stack
-
HTML

-
CSS
-
JavaScript (ES6+)

-
Figma

-
Grafana

-
Git
-
GitLab

-
Agile
-
JIRA
-
Slack
-
Zoom
Future Plans
The next phase focuses on innovatively and engagingly representing all client services graphically, enhancing dashboard usability and functionality beyond standard widgets.
ConclusionThis project showcases P2H’s expertise in delivering bespoke, aesthetically superior, and highly functional data visualization solutions. Through innovative design, technical prowess, and client-centric development, we achieved a product that goes beyond traditional dashboard visualization, catering to the specific needs of a high-profile client in the government sector.